The AI Assistant Dashboard gives you real-time insight into how your Virtual Assistant is performing across conversations, topics, user feedback, and key impact metrics. Use this data to fine-tune your Assistant and deliver better guest service.
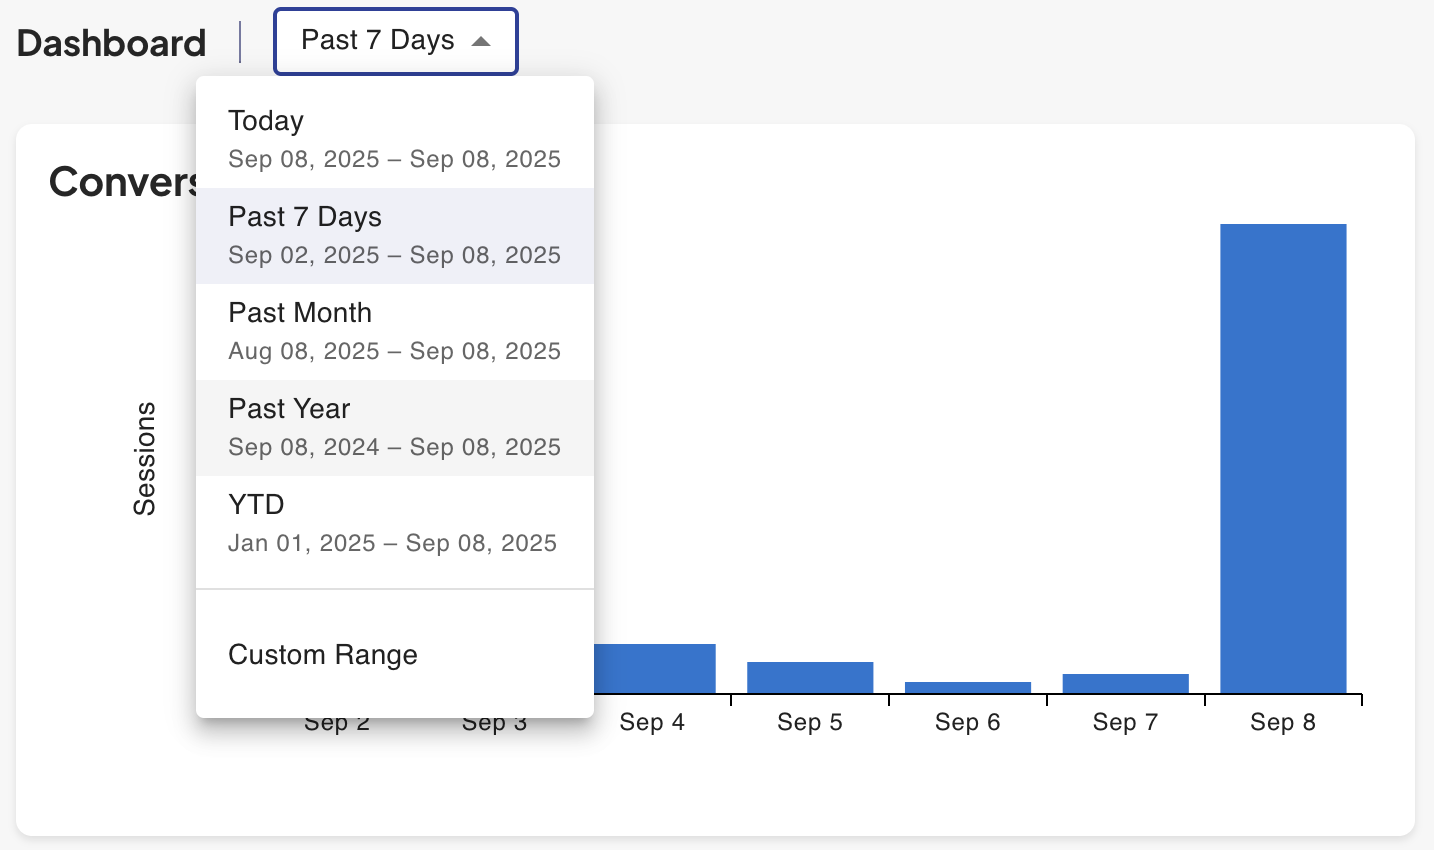
📅 Selecting Date Range
By default, your dashboard will show data from all time. You can adjust by selecting one of our default options, or create a custom range
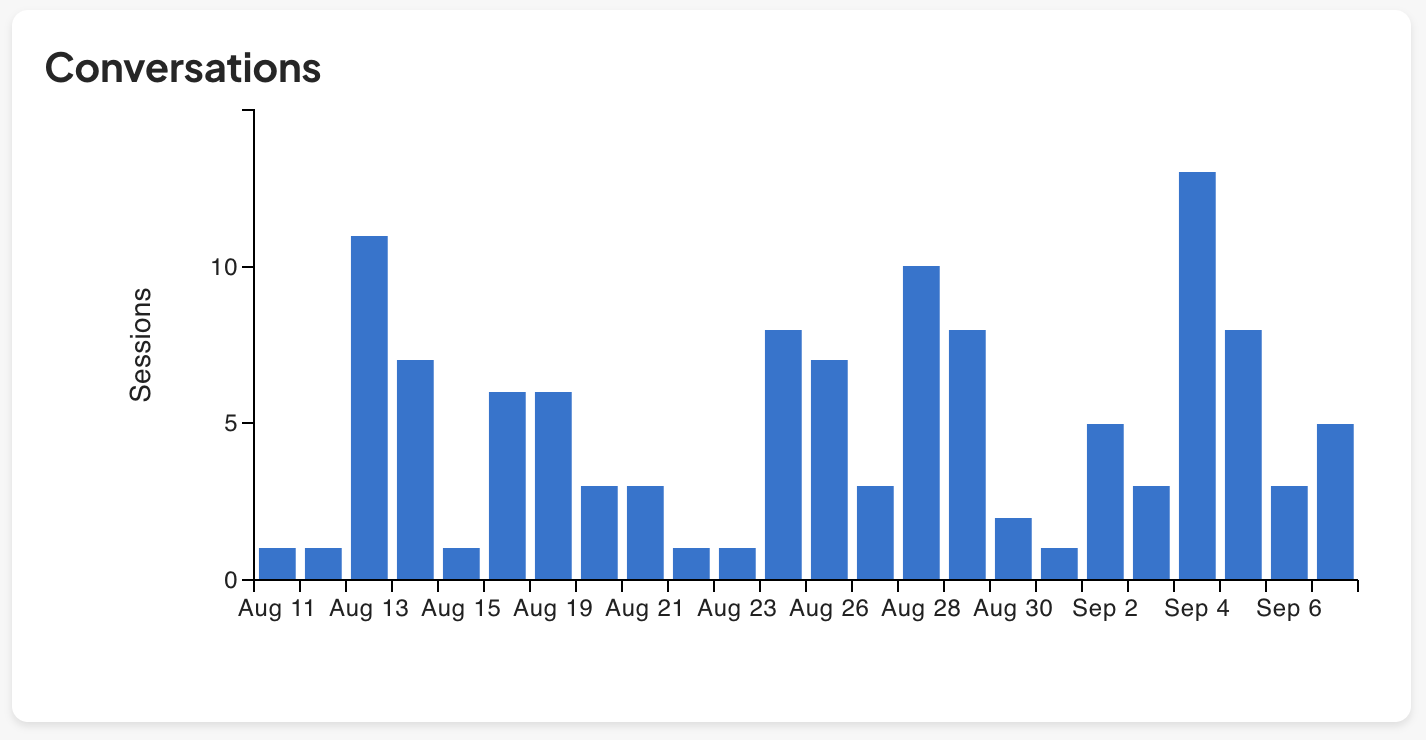
💬 Conversations Chart
The Conversations bar chart shows daily activity over your selected date range.
Each bar represents the number of Assistant sessions per day—helping you spot trends in engagement and volume.
Use this data to understand guest behavior patterns, identify peak days, and monitor Assistant usage during promotions or busy periods.
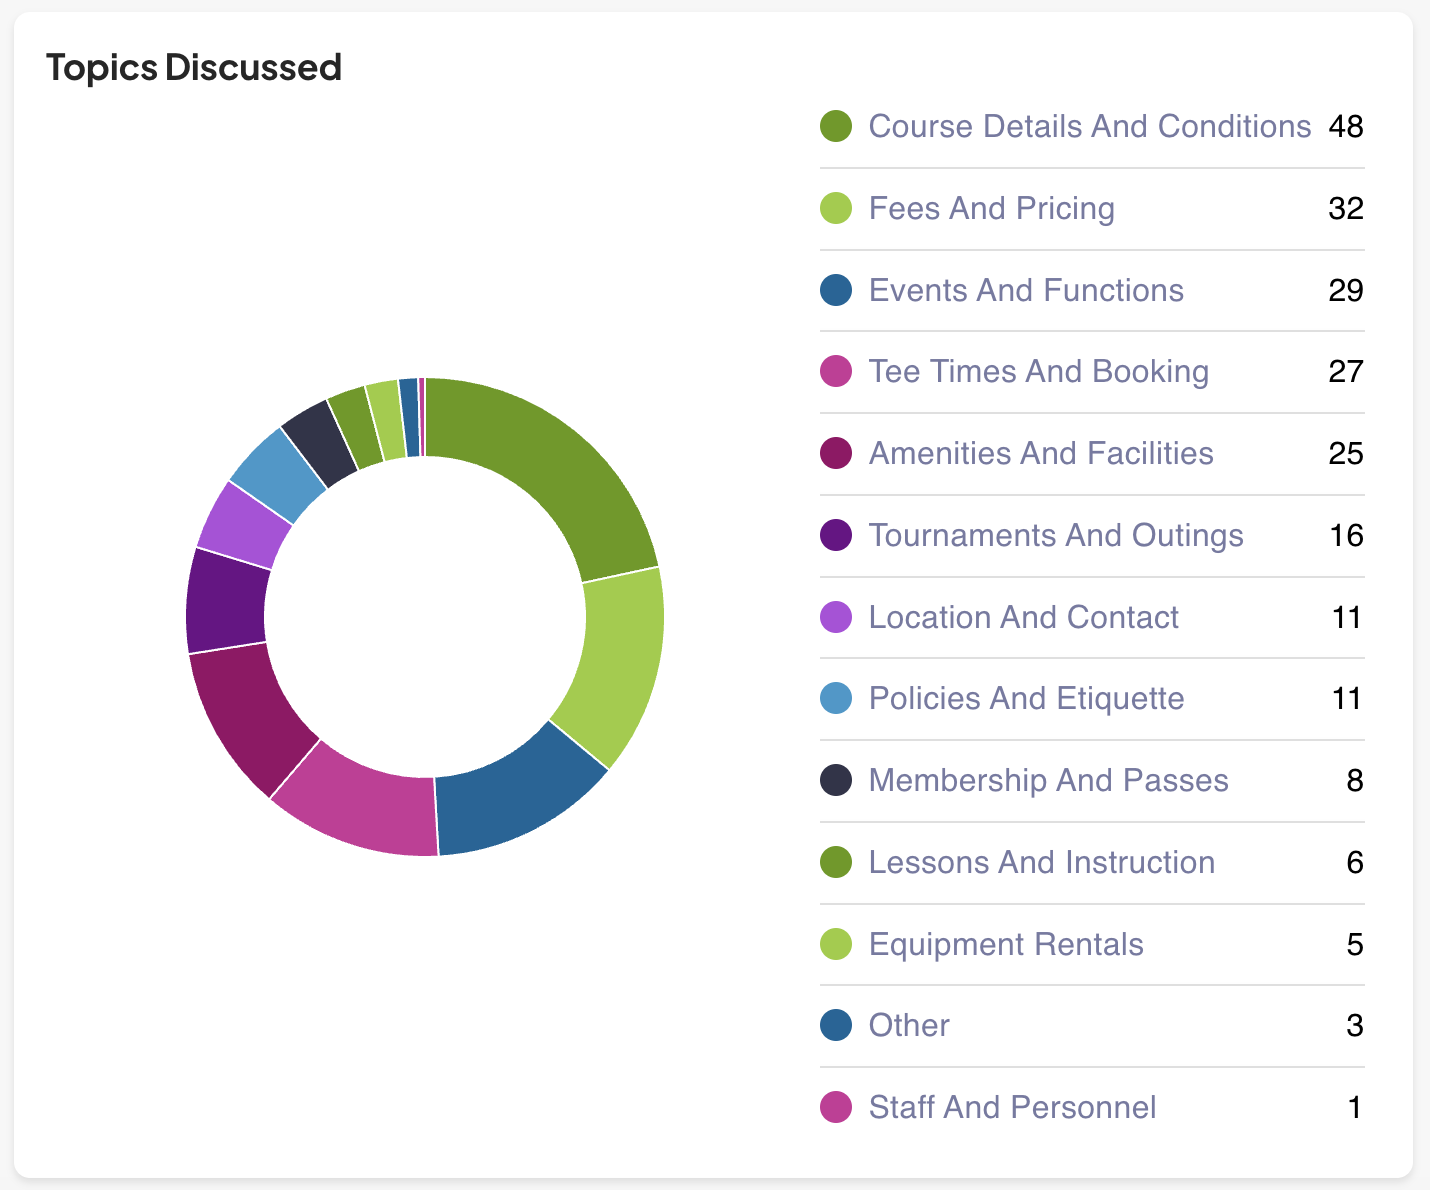
🧠 Topics Discussed
This Topics Discussed donut chart categorizes what guests are asking about. Each segment represents how many times that category was mentioned across conversations in the selected date range.
Use this chart to guide updates to your knowledge base. For example, if “Fees and Pricing” is a top topic, double-check that section is clear and current.
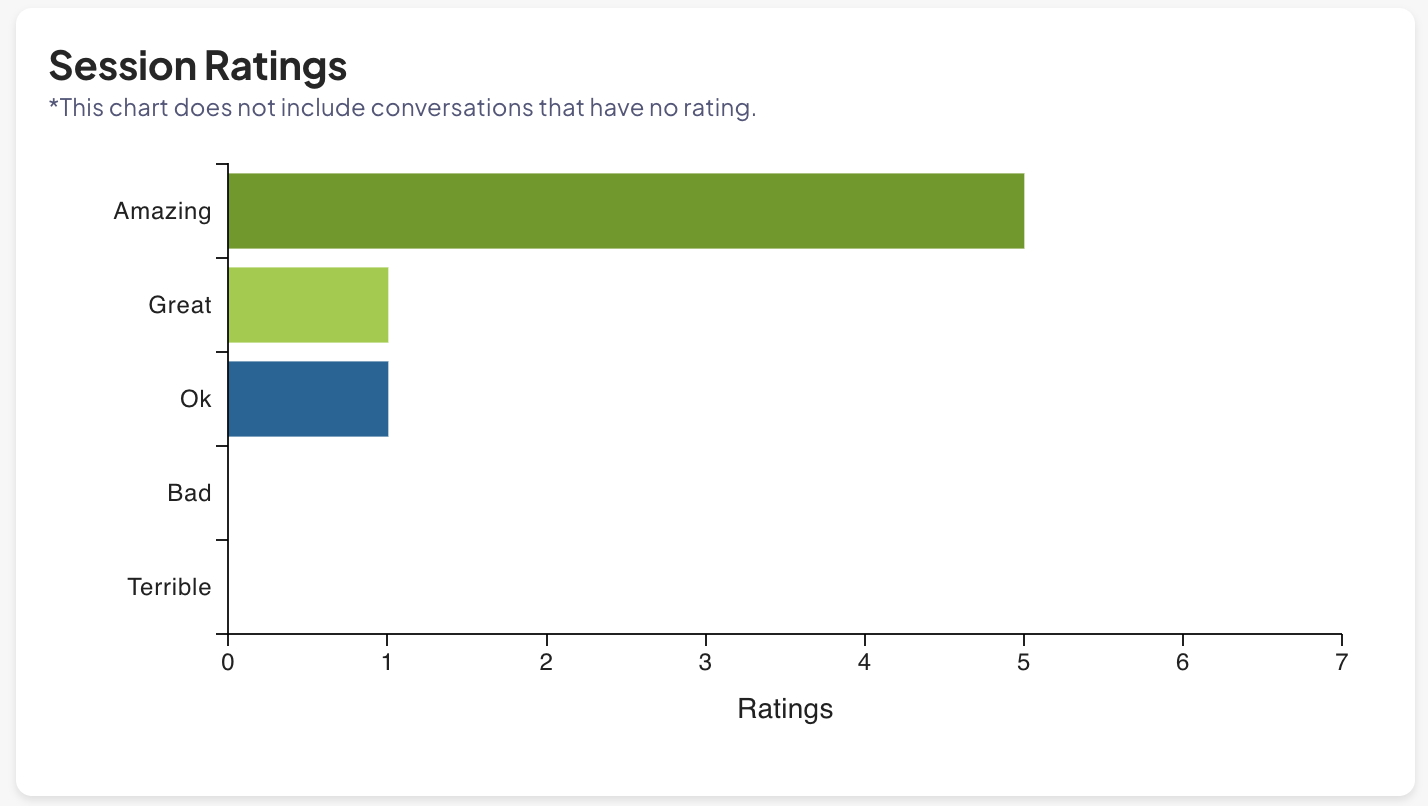
⭐ Session Ratings
This section displays guest feedback scores from rated conversations.
Rating scale includes:
- Amazing
- Great
- OK
- Bad
- Terrible
Guests only rate sessions voluntarily, so this chart gives insight into standout experiences or potential friction points.
📈 Performance Metrics (Right-Side Tiles)
Quick summary metrics for the selected date range:
- Total Conversations
- Calls Saved: This is an estimated number of phone calls avoided because of the Assistant
- Abandonment: This is the number of conversations where the AI Assistant doesn’t think the conversation ended properly
- Average Session Duration: Average length of time of the conversation from start to completion
- Booking Link Clicked: How many times the Assistant successfully drove users to your booking engine
- Added to Waitlist: The number of searches created from your Assistant
These KPIs help you quantify value from the Assistant—both in customer experience and operational efficiency.
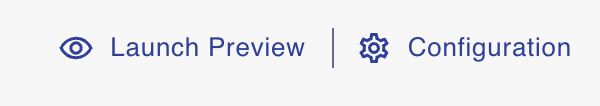
⚙️ Assistant Preview & Configuration
In the top right corner of the dashboard, you’ll find two important tools:
- 🔍 Launch Preview – Opens a preview of what guests see when they use the Assistant
- ⚙️ Configuration – Takes you to the settings page where you can:
- Edit the welcome message
- Add website URLs
- Adjust data sync settings
Use Preview to test your updates before going live, and Configuration to keep your content fresh and accurate.
💬 Need Help?
Reach out to your Noteefy Customer Success Manager or email customersuccess@noteefy.app for help understanding your AI Assistant Dashboard.